


TYStatistics is is a program for statistical analysis of sampled data. It can be used to reshape data, draw plots with data and classic tests like T Test.
Probability Distribution :
Normal, Chi Square, F, T, Uniform, Poisson, Geometric, Negative Binomial, Hypergeometric, Beta, Cauchy, Exponential, Gamma, LogNormal, Logistic,
Wilcoxon, Weibull, Wilcoxon Rank Sum Statistic.
Plot Type :
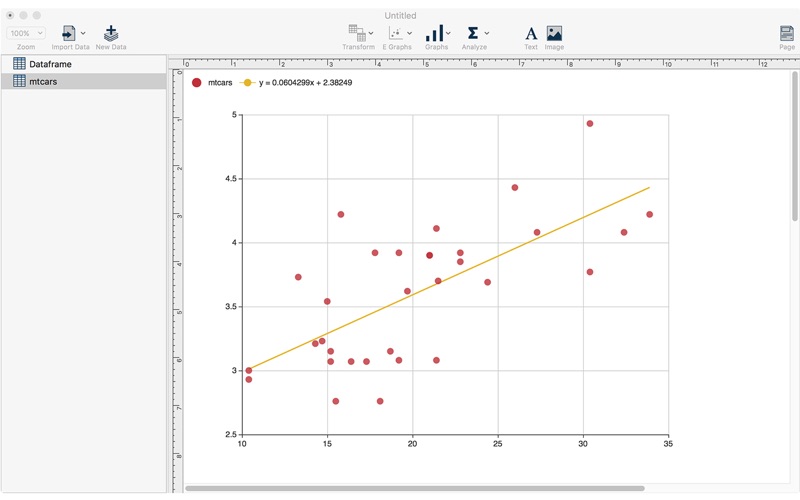
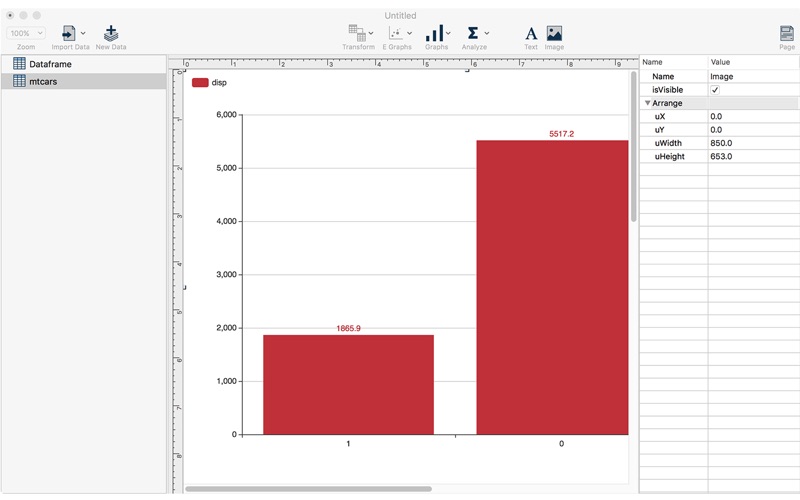
• Scatter, Line,Bar ,Stack ,Pie,Graph Plot
• Boxplot,Normal QQ ,Histogram,Ribbon,Stack Area Plot
Classic Test :
• One-Sample T Test
• Two-Sample T Test
• Normality Test (Anderson Darling,Shapiro-Wilk and Jarquebera)
• One-Sample Z Test
• F(Var) Test
• Two-Sample Z Test
• Two-Proportion Z test
• Two-Sample Sign Test
• Binomial Test
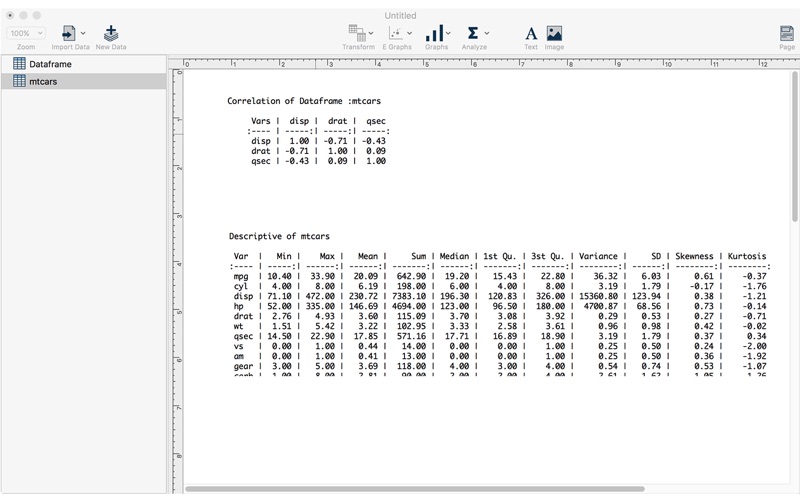
• Correlation (Pearson and Spearman)
Online Help: http://www.tyevolution.com/nr.jsp?_np=0_315_12